
When I first started working with networks, one thing became clear very quickly: most issues don’t come from sudden failures; they build up quietly over time. A small spike in latency, a link nearing saturation, or an overloaded device often goes unnoticed until users start complaining. That’s where network monitoring becomes essential.
With 98% of organizations reporting that just one hour of downtime costs more than $100,000, and many losing far more, network monitoring has shifted from optional to mission-critical. By detecting issues minutes earlier and cutting outage costs in half, modern network visibility gives teams the edge they need in increasingly complex infrastructures.
Network monitoring is the continuous process of tracking the health, performance, and availability of a network to ensure it operates reliably. It helps me understand how data moves across devices, identify abnormal behavior, and detect potential issues before they impact users or business operations. Instead of reacting to outages, network monitoring allows teams to take a proactive approach by spotting patterns, bottlenecks, and risks early.
In this article, I’ll break down what network monitoring is, how it works step by step, the key metrics and protocols involved, common use cases, and the challenges teams face when monitoring modern, distributed networks.
What Is Network Monitoring?
Network monitoring is the continuous process of observing a network’s health, performance, and availability to ensure everything works as expected. It involves tracking how network devices, links, and services behave in real time, such as latency, traffic flow, packet loss, and device status, so issues can be detected and addressed before they affect users or business operations.
Instead of reacting to outages after they happen, network monitoring helps identify early warning signs like abnormal traffic patterns, overloaded links, or failing hardware.
How Network Monitoring Works (Step-by-Step)
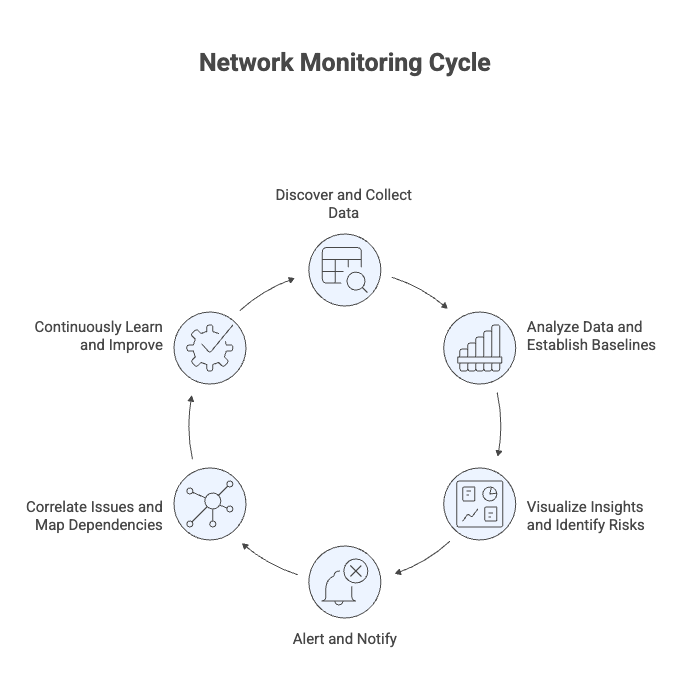
From my experience, network monitoring only makes sense when you understand the process behind it. It isn’t a single action, but a continuous cycle that repeats as network conditions change.
Step 1: Discover and Collect Network Data
In practice, every monitoring setup starts with visibility. If you don’t know what exists on the network, everything that follows becomes unreliable.
Network monitoring starts by finding what’s on the network (routers, switches, firewalls, servers, interfaces, cloud resources) and then collecting basic health and performance data from them on a regular schedule. Tools do this using methods like IP scanning, DNS checks, SNMP, and ICMP (ping).
What gets collected first:
Device availability (up/down)
Latency and packet loss
Interface bandwidth/utilization
Basic CPU/memory on key devices
This creates your baseline visibility, what exists, what’s reachable, and how it’s behaving right now.
Step 2: Analyze Data and Establish Baselines
Once data is collected, the monitoring system analyzes it over time to understand what “normal” looks like for each device, link, and service. Instead of relying only on fixed thresholds, it builds performance baselines based on historical patterns such as daily peaks, business hours, and recurring traffic trends.
By comparing real-time metrics against these baselines, the system can detect:
Abnormal spikes in latency or traffic
Early signs of congestion or resource exhaustion
Misconfigurations or degrading hardware
This step turns raw metrics into meaningful signals, helping teams spot issues early rather than reacting after failures occur.
Step 3: Visualize Insights and Identify Risks
After analyzing the data, the monitoring system presents insights through dashboards, charts, and reports so teams can quickly understand what’s happening across the network. Instead of digging through raw metrics, engineers get a clear view of network health, traffic trends, and devices or links that are at risk.
This step helps teams:
See overall network health at a glance
Identify recurring performance issues
Spot risk patterns before they lead to outages
Visualization turns analysis into actionable awareness, making it easier to prioritize what needs attention first.
Step 4: Alert and Notify When Action Is Needed
When the monitoring system detects abnormal behavior or a risk that crosses defined thresholds, it triggers alerts to notify the right people at the right time. These alerts are sent through channels like email, chat tools, or incident systems, depending on how teams work.
Effective alerts include context, such as:
Which device or link is affected
How severe the issue is
What services or users might be impacted
This ensures teams can respond quickly and prioritize correctly, fixing issues before they escalate into downtime.
Step 5: Correlate Issues and Map Dependencies
Once alerts are triggered, the monitoring system correlates related signals across devices, links, and services to show how issues are connected. It uses topology and dependency mapping to reveal how network components support applications and business services.
This step helps teams:
Identify the true root cause instead of chasing symptoms
Understand which services and users are affected
Prevent cascading failures across the network
By connecting network behavior to real services, teams can focus remediation where it matters most.
Step 6: Continuously Learn and Improve Monitoring
After issues are resolved, the monitoring process feeds new data back into the system, refining baselines, thresholds, and alert rules. As traffic patterns change, new devices are added, or workloads move to the cloud, the monitoring setup adapts automatically.
This final step ensures:
Monitoring stays accurate as the network evolves
False alerts are reduced over time
Future issues are detected earlier
Because networks are always changing, this feedback loop keeps monitoring continuous and effectively, not a one-time setup.
Core Network Monitoring Metrics
Over time, I’ve found that metrics are where monitoring either succeeds or fails. Tracking too much creates noise, while tracking too little creates blind spots.
Core network monitoring metrics help you understand whether the network is fast, stable, and reliable under real-world conditions. By tracking these indicators continuously, it becomes possible to detect performance degradation early and prevent small issues from turning into outages.
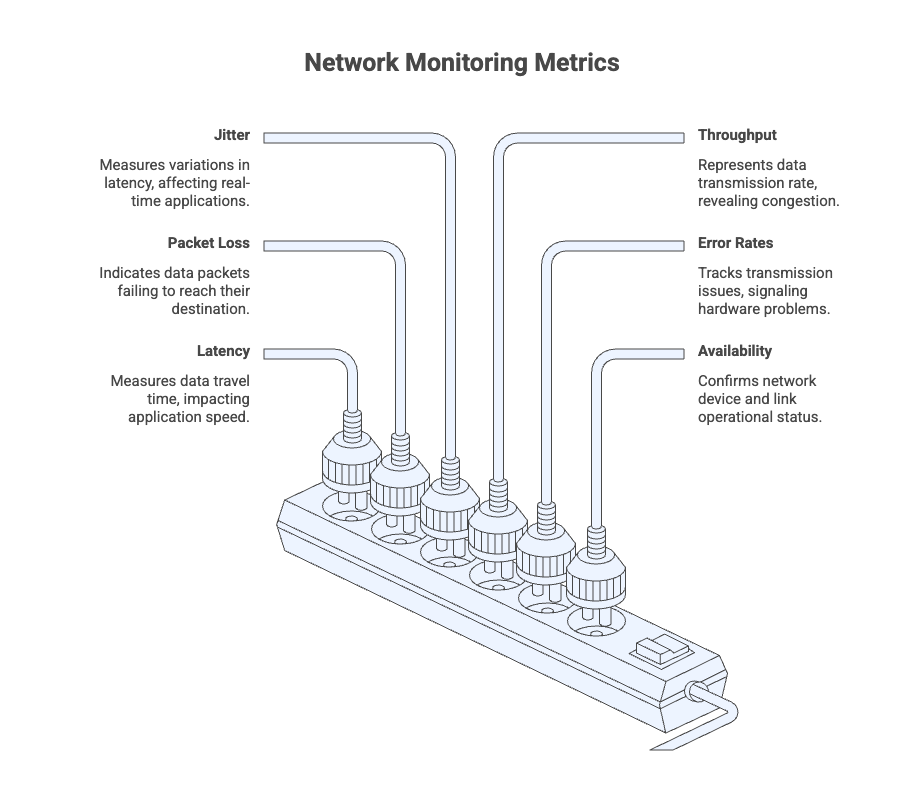
Latency
Latency measures how long it takes for data to travel from one point to another across the network. High latency can cause slow applications, delayed responses, and poor user experience.
Packet Loss
Packet loss shows the percentage of data packets that fail to reach their destination. Even small amounts of packet loss can lead to dropped connections, failed requests, or choppy voice and video calls.
Jitter
Jitter measures variations in latency over time. Inconsistent delivery is especially harmful for real-time applications like VoIP and video conferencing.
Throughput
Throughput represents how much data is successfully transmitted over the network in a given period. Low throughput often indicates congestion, inefficient routing, or capacity limits.
Error Rates
Error rates track transmission issues such as dropped packets, CRC errors, or interface failures. Rising error rates can signal hardware degradation or physical link problems.
Availability
Availability confirms whether network devices, links, and paths are reachable and operational. It is a foundational metric for uptime tracking and SLA monitoring.
Key Network Monitoring Protocols and Data Sources
Different protocols answer different questions. In real environments, relying on just one data source rarely provides enough context to understand what’s actually happening.
Network monitoring relies on multiple protocols and data sources to understand different aspects of network behavior. Some confirm whether a device is reachable, others show how it’s performing, and some explain how traffic flows across the network. Together, they provide complete visibility into network health and performance.
Simple Network Management Protocol (SNMP)
SNMP is one of the most widely used protocols in network monitoring. It allows monitoring tools to poll network devices for operational data such as CPU usage, memory consumption, interface traffic, error rates, and device uptime.
Internet Control Message Protocol (ICMP)
ICMP is commonly used to check device reachability and network responsiveness through ping-based tests. It helps identify availability issues, latency, and packet loss, making it a key early warning signal for network problems.
Flow-Based Protocols (NetFlow, sFlow, IPFIX)
Flow protocols focus on traffic behavior rather than device health. They reveal who is communicating on the network, how much bandwidth is being used, and which applications are consuming capacity, helping teams identify congestion and unusual traffic patterns.
Syslog
Syslog collects event and log messages from network devices, servers, and applications. It provides context around configuration changes, authentication failures, and system errors, which is critical for troubleshooting and root cause analysis.
Windows Management Instrumentation (WMI)
WMI is used in Windows environments to collect detailed system-level metrics such as CPU usage, disk activity, running services, and event logs from Windows servers and endpoints.
Application Programming Interfaces (APIs)
APIs enable monitoring of cloud services, SaaS platforms, and managed infrastructure that don’t expose traditional network protocols. They provide direct access to performance, usage, and health data from cloud providers and applications.
Secure Shell (SSH)
SSH is used when deeper or custom data collection is required. Monitoring tools may use SSH to run commands, gather logs, or collect metrics from devices that don’t fully support SNMP or APIs.
Common Network Monitoring Use Cases
In real-world environments, network monitoring isn’t applied uniformly. The value shows up differently depending on architecture, scale, and how applications are delivered.
Hybrid and Multi-Cloud Monitoring
Modern networks rarely exist in a single environment. Applications and data often span on-premises infrastructure, public cloud platforms, and SaaS services, making visibility harder to maintain. Hybrid and multi-cloud network monitoring helps track performance, availability, and traffic flow across these environments as a single system.
By monitoring latency, packet loss, and routing paths between on-prem and cloud resources, teams can quickly identify where performance degrades—whether the issue originates in the data center, the cloud provider, or the network path connecting them. This unified view is critical for maintaining consistent application performance and avoiding blind spots in distributed architectures.
Performance Optimization and Bottleneck Detection
Network performance issues often develop gradually, long before they cause visible outages. Continuous network monitoring helps identify early signs of congestion, inefficient routing, or resource saturation by tracking metrics such as throughput, latency, and interface utilization over time.
By analyzing traffic patterns and performance trends, it becomes easier to pinpoint bottlenecks, whether they occur on a specific link, device, or application path. This allows teams to optimize routing, rebalance traffic, or plan capacity upgrades proactively, improving overall network efficiency and preventing performance degradation before users are affected.
Faster Troubleshooting Across Distributed Networks
When networks span multiple locations, cloud environments, and remote users, identifying the root cause of an issue can be time-consuming. Network monitoring brings data from devices, links, and traffic paths into a single view, making it easier to trace problems end to end.
By correlating alerts, performance metrics, and traffic flows, teams can quickly determine whether an issue is caused by a failing device, a congested link, or an application dependency. This reduces guesswork, shortens resolution time, and helps restore services faster across distributed network environments.
Data Center and Environmental Monitoring
Not all network issues originate from traffic or configuration problems. Physical conditions inside data centers, such as temperature, humidity, and power stability, can directly impact network equipment and service availability. Network monitoring helps correlate environmental data with device and performance metrics to detect risks early.
By monitoring factors like overheating, power fluctuations, or cooling failures alongside network health, teams can prevent hardware damage, unplanned downtime, and cascading failures. This added layer of visibility is especially important in high-density data centers, where small environmental changes can quickly affect multiple systems.
Application and Service Monitoring
Network performance directly affects how applications and services behave for end users. Application and service monitoring connect network metrics with application health to show whether performance issues are caused by the network, the application itself, or the infrastructure supporting it.
By tracking response times, error rates, and traffic paths between services, teams can quickly identify which dependencies are slowing things down. This helps ensure critical applications remain available and responsive, and it prevents network-related issues from being misdiagnosed as application failures.
Types of Network Monitoring
No single type of monitoring covers everything. In practice, effective visibility comes from combining multiple approaches rather than relying on one. Using the right combination helps teams gain complete visibility without unnecessary noise.
Performance Monitoring
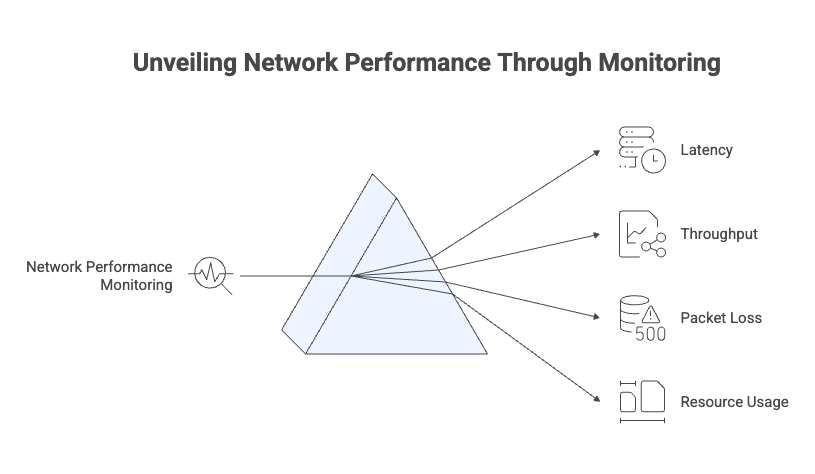
Performance monitoring tracks key metrics such as latency, throughput, packet loss, and device resource usage to understand how well the network is operating under real workloads. It helps identify slowdowns, congestion, and capacity limits early, allowing teams to optimize performance before users experience degradation.
Availability Monitoring
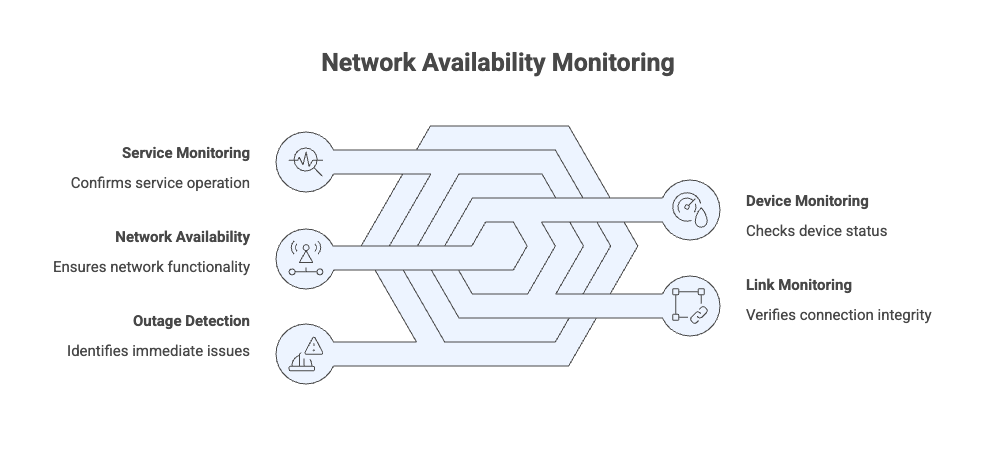
Availability monitoring checks whether network devices, links, and services are reachable and functioning as expected. It provides a clear up-or-down view of the network and acts as the first indicator of outages or connectivity failures that require immediate attention.
Traffic and Flow Monitoring
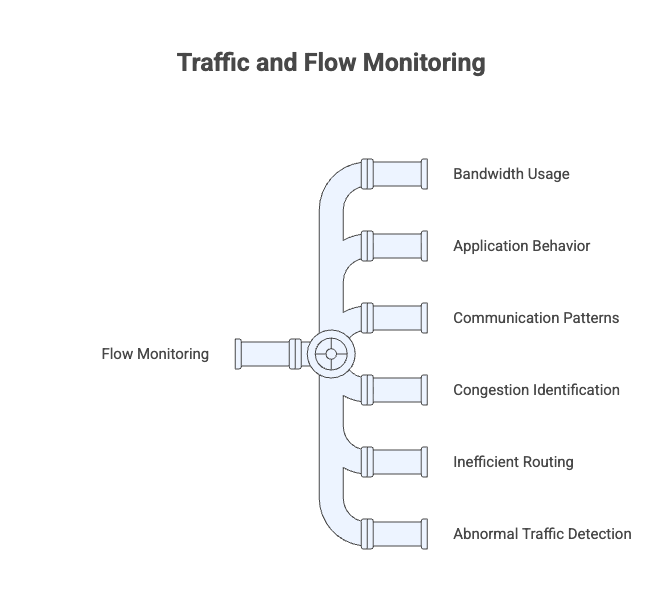
Traffic and flow monitoring analyzes how data moves across the network using flow data. It reveals bandwidth usage, application behavior, and communication patterns between systems, helping identify congestion, inefficient routing, and unexpected or abnormal traffic.
Event and Log Monitoring
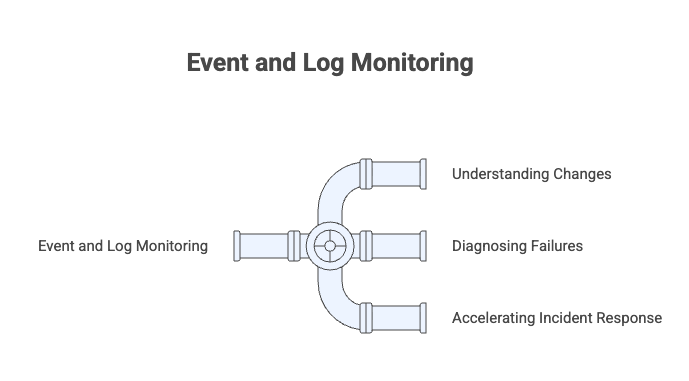
Event and log monitoring collects system messages, configuration changes, and error logs from network devices and services. This context helps teams understand what changed, why a failure occurred, and speeds up root cause analysis during incidents.
Configuration and Change Monitoring
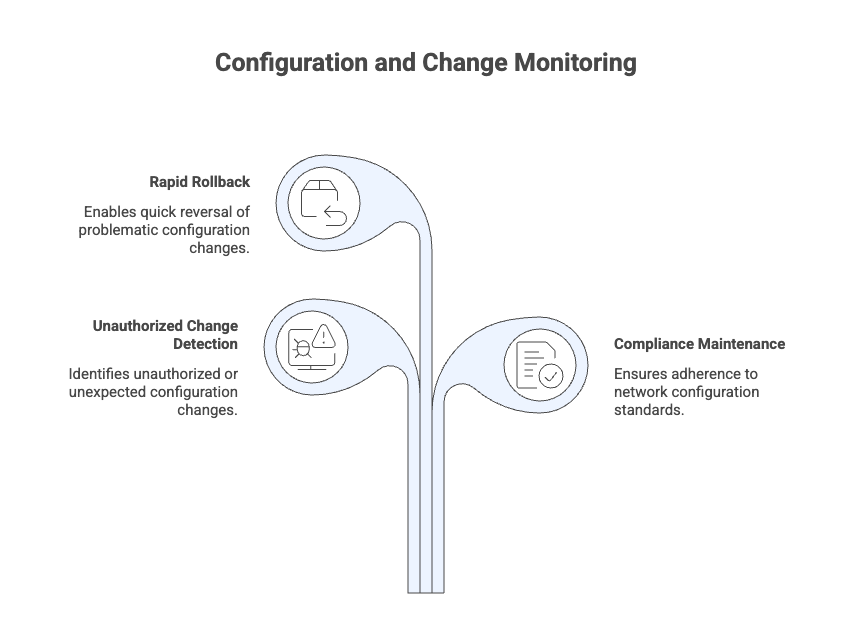
Configuration and change monitoring tracks updates made to network device configurations over time. It helps detect unauthorized or unexpected changes, maintain compliance, and quickly roll back modifications that lead to performance or availability issues.
Application and Digital Experience Monitoring
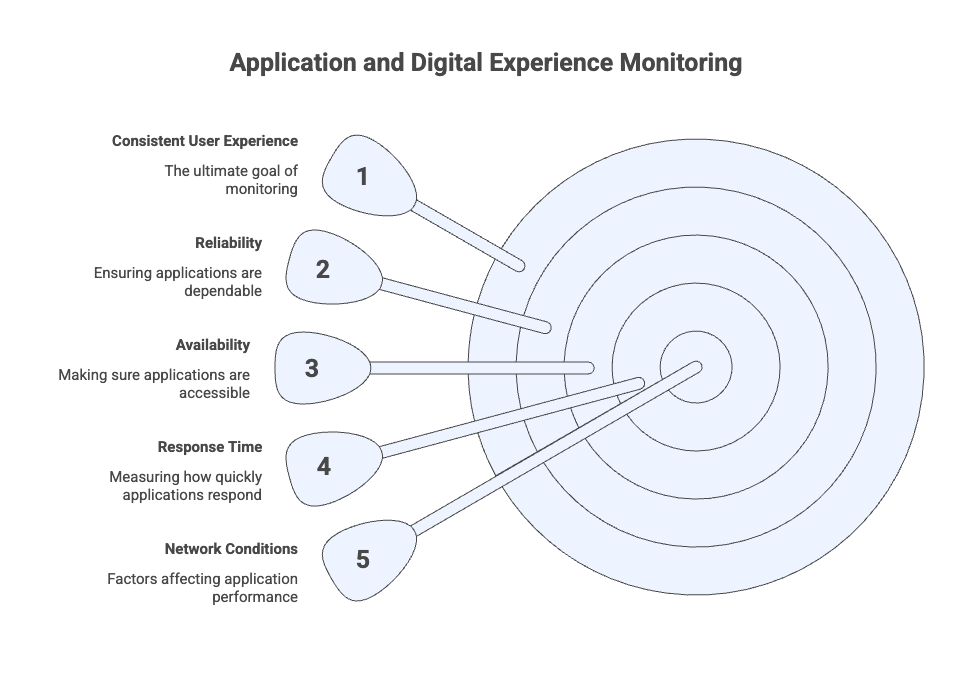
Application and digital experience monitoring focuses on how applications and services perform from a user’s perspective. It measures response time, availability, and reliability across different locations and network conditions, helping teams ensure consistent user experience and quickly identify network-related performance issues.
Benefits of Network Monitoring
When network monitoring is implemented correctly, the benefits go far beyond alerting. The biggest gains come from clarity, confidence, and the ability to act quickly.
Network monitoring provides continuous visibility into how a network behaves under real-world conditions. Instead of reacting to outages or user complaints, teams can identify issues early and respond based on reliable data.
Improved network visibility
Monitoring makes it easier to see all connected devices, traffic flows, and dependencies across on-prem, cloud, and hybrid environments, reducing blind spots.
Reduced downtime and faster issue resolution
By detecting abnormal behavior early and providing contextual alerts, network monitoring helps teams respond quickly and minimize service disruptions.
Better performance and user experience
Tracking metrics like latency, packet loss, and throughput helps maintain consistent application performance and prevents slowdowns that impact users.
Proactive capacity and growth planning
Historical data and trends reveal when links, devices, or services are nearing capacity, enabling smarter infrastructure planning and upgrades.
Stronger security awareness
Unusual traffic patterns, unknown devices, or sudden configuration changes can be identified early, helping teams spot potential security risks.
More efficient use of IT resources
Automation and centralized visibility reduce manual troubleshooting, allowing teams to focus on higher-value work instead of constant firefighting.
Biggest Challenges in Network Monitoring
Even with mature tools, network monitoring isn’t without challenges. Most of the difficulties I’ve seen come from scale, complexity, and misaligned expectations.
Growing network complexity - Modern networks span on-prem infrastructure, cloud platforms, SaaS services, and remote users, making end-to-end visibility harder to maintain.
Limited visibility into encrypted traffic - As more traffic is encrypted, it becomes difficult to inspect or analyze communication patterns without additional context or tooling.
Alert fatigue - Poorly tuned thresholds and excessive notifications can overwhelm teams, causing important alerts to be missed or ignored.
Tool sprawl and fragmented data - Using multiple disconnected monitoring tools creates data silos, increases operational overhead, and slows down troubleshooting.
Scaling monitoring with network growth - As networks expand, monitoring systems must handle higher data volumes, more devices, and faster change without losing accuracy.
Distinguishing real issues from normal behavior - Traffic patterns change constantly, making it challenging to separate genuine performance problems from expected usage spikes.
Keeping monitoring configurations up to date - Frequent changes in infrastructure, cloud workloads, and applications require continuous updates to monitoring rules and baselines.
Network Monitoring Best Practices
These practices aren’t theoretical. They’re shaped by common failure points and lessons learned from maintaining monitoring setups over time.
Effective network monitoring is not just about collecting data; it’s about collecting the right data, interpreting it correctly, and acting on it consistently. Following a few core best practices helps ensure monitoring remains accurate, actionable, and scalable as networks evolve.
Maintain complete and accurate visibility
Start with comprehensive asset discovery across on-premises infrastructure, cloud environments, and SaaS services. Monitoring gaps often occur when devices, links, or workloads are added without being enrolled, leading to blind spots during incidents.
Focus on meaningful metrics
Not every metric needs to be tracked continuously. Prioritize indicators that directly affect availability, performance, and user experience, such as latency, packet loss, throughput, and error rates. This keeps monitoring signal-driven rather than noise-driven.
Use baselines instead of fixed thresholds
Static thresholds rarely reflect real-world network behavior. Establishing baselines from historical data helps distinguish normal usage spikes from genuine performance issues, reducing false alerts.
Design alerts for action, not volume
Alerts should provide context, what’s affected, how severe it is, and what might be impacted, so teams can respond quickly. Well-tuned alerting reduces fatigue and improves incident response times.
Correlate data across layers
Combining metrics, logs, events, and topology data makes it easier to identify root causes instead of treating symptoms in isolation. Correlation is essential for troubleshooting complex, distributed environments.
Review and adapt continuously
Networks change constantly. Regularly revisiting monitoring coverage, baselines, and alert rules ensures the system remains accurate and aligned with current infrastructure and traffic patterns.
Network Monitoring vs Observability
This distinction often comes up in real conversations, especially as environments become more distributed and cloud-native.
Frequently Asked Questions?
1. Is network monitoring only for large enterprises?
No. Network monitoring is useful for organizations of all sizes. Small and mid-sized networks benefit from early issue detection just as much as large enterprises, especially as cloud usage and remote access increase.
2. How do I know if my current network monitoring setup is outdated?
If your tools lack visibility into cloud workloads, generate too many false alerts, or fail to provide clear root cause insights, your monitoring setup may no longer match your network’s complexity.
3. Do I need separate monitoring tools for on-prem and cloud environments?
Not necessarily. Many modern monitoring platforms support hybrid and multi-cloud environments, allowing teams to monitor on-prem, cloud, and SaaS resources from a single view.
4. How often should network data be collected?
Most monitoring systems collect data every few minutes, but the frequency depends on the criticality of the device or service. Core infrastructure is usually monitored more frequently than non-critical endpoints.
5. Can network monitoring help with security issues?
Yes. While it is not a replacement for security tools, network monitoring can detect unusual traffic patterns, unknown devices, or sudden configuration changes that may indicate security risks.
6. What’s the difference between alerts and incidents?
An alert is a notification triggered by abnormal behavior or thresholds. An incident is a confirmed issue that requires investigation or action, often created after correlating multiple alerts.
Conclusion
Network monitoring is no longer just about checking whether devices are up or down. As networks span on-prem infrastructure, cloud platforms, applications, and remote users, effective monitoring requires continuous visibility, context, and the ability to detect issues before they escalate. From tracking core performance metrics to understanding traffic behavior and dependencies, network monitoring provides the foundation for stable and reliable operations.
When done well, it shifts teams from reactive troubleshooting to proactive management. Patterns become visible, risks are identified earlier, and decisions are guided by data rather than assumptions. While challenges like scale, alert fatigue, and complexity remain, applying the right practices and maintaining clear visibility ensures monitoring stays effective as networks evolve.
Ultimately, network monitoring isn’t a one-time setup; it’s an ongoing discipline that adapts with the network and supports consistent performance, reliability, and user experience.