
Network failures are rarely isolated events. In most enterprise environments, they emerge from gradual shifts in traffic patterns, sustained resource pressure, or subtle changes in device behavior that go unnoticed until they begin to affect users or critical services.
Network monitoring works by continuously collecting and analyzing these signals in real time. Rather than reacting after disruptions occur, monitoring systems establish performance baselines, detect deviations, and surface early indicators of risk across the network.
This continuous visibility allows teams to understand normal network behavior, correlate performance changes with underlying causes, and respond with precision instead of guesswork.
In this article, I explain how network monitoring works step by step, from data collection and analysis to alerting and troubleshooting, and how modern monitoring platforms help enterprises maintain performance, availability, and security across increasingly complex environments.
How Network Monitoring Works?
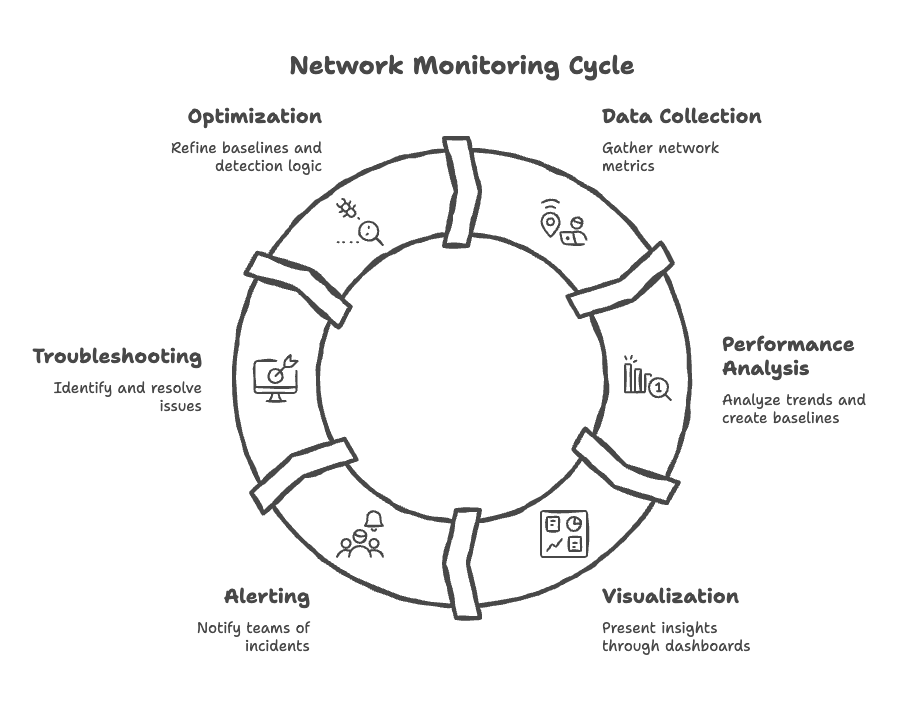
Step 1: Network Discovery and Data Collection
The first step in network monitoring is establishing accurate visibility into the environment and collecting the right data from it. Without a clear understanding of network devices, interfaces, services, and traffic paths, monitoring efforts remain incomplete and unreliable.
Network monitoring systems begin by discovering assets such as routers, switches, firewalls, servers, and cloud resources. This discovery may be automated or manually configured, but the objective is consistent: to create an accurate, up-to-date inventory of what needs to be monitored and how components are interconnected.
Once discovery is complete, the monitoring platform collects operational data at regular intervals. This includes metrics such as latency, packet loss, bandwidth utilization, error rates, and resource usage. Over time, continuous data collection establishes a reliable baseline of normal and peak behavior, forming the foundation for analysis, alerting, and troubleshooting in later stages.
Step 2: Performance Analysis and Baseline Creation
Once data is collected consistently, the next step is converting raw metrics into meaningful insight. Individual data points in isolation rarely provide enough context to explain network behavior or performance risk.
Network monitoring systems analyze performance trends over time to understand how devices, links, and services behave under normal operating conditions. By observing patterns across different time periods, such as business hours, peak traffic windows, or seasonal spikes, the monitoring platform establishes performance baselines.
These baselines define expected behavior for metrics like latency, bandwidth usage, and resource consumption, rather than relying on static thresholds that often fail to reflect real-world conditions. With baselines in place, monitoring systems can detect deviations that signal emerging issues, enabling teams to identify degradation early, distinguish normal variation from genuine problems, and respond proactively before minor anomalies escalate into outages or service disruptions.
Step 3: Visualization and Contextual Insights
After performance data is analyzed and baselines are established, the next step is presenting that information in a way that teams can quickly understand and act on. Network monitoring systems achieve this through dashboards, visualizations, and topology views that summarize network health clearly and consistently.
Visual context allows teams to see how devices, links, and services relate to one another instead of interpreting metrics in isolation. Topology maps and service views expose traffic paths, dependencies, and potential single points of failure, making it easier to assess the scope and impact of an issue as performance begins to degrade.
By combining real-time metrics with historical trends and network context, visualization supports faster, more confident decision-making. Teams can identify where a problem is occurring, understand how far it extends, and prioritize response efforts based on operational and business impact rather than raw alert volume.
Step 4: Alerting and Incident Detection
Once performance data is analyzed and visualized, network monitoring systems use that insight to detect incidents and notify teams when action is required. Alerting is driven by a combination of predefined thresholds, learned performance baselines, and anomaly detection to ensure notifications represent meaningful deviations rather than normal fluctuations.
Effective alerting emphasizes relevance and context. Instead of generating isolated alarms, monitoring systems correlate related signals, such as rising latency, packet loss, and interface errors, to identify incidents that pose real risk to network performance or availability.
When an incident is detected, alerts are delivered through appropriate channels with sufficient context to support rapid triage. By clearly indicating severity, affected components, and potential impact, alerting enables teams to respond consistently and prevent issues from escalating into user-facing disruptions.
Step 5: Troubleshooting and Root Cause Analysis
When an incident is detected, the focus shifts from awareness to resolution. Network monitoring systems support troubleshooting by correlating alerts, performance metrics, traffic patterns, and topology data to pinpoint where an issue is occurring and why it is happening.
Rather than examining devices in isolation, teams can trace issues across the network to understand how different components influence one another. This makes it possible to determine whether a problem stems from a congested link, a misconfigured device, resource exhaustion, or an external dependency affecting service delivery.
By combining historical data with real-time insights, monitoring platforms allow teams to compare current behavior against established baselines. This context accelerates root cause analysis, reduces time spent on manual investigation, and enables accurate resolution instead of relying on trial-and-error fixes.
Step 6: Continuous Monitoring and Optimization
Network monitoring does not end once an incident is resolved. In enterprise environments, it operates as a continuous loop where data collection, analysis, alerting, and troubleshooting constantly inform one another as network conditions evolve.
As new applications are deployed, traffic patterns shift, and infrastructure changes over time, monitoring systems adapt by refining baselines and adjusting detection logic. This ensures visibility remains accurate and relevant, even as network complexity increases.
By treating network monitoring as an ongoing process rather than a reactive task, enterprises move beyond firefighting incidents and maintain consistent performance, availability, and resilience across their environments.
Conclusion
Network monitoring works best when treated as a continuous, interconnected process rather than a set of isolated tasks. Each stage, from data collection and analysis to alerting and root cause investigation, builds on the previous one to deliver accurate, real-time visibility into network behavior, illustrating clearly how network monitoring works in modern enterprise environments.
By combining consistent monitoring with contextual analysis, enterprises gain the ability to detect issues early, understand their impact, and resolve them efficiently. This reduces downtime, improves operational confidence, and ensures the network can reliably support business-critical services as environments grow more complex.
Ultimately, effective network monitoring allows teams to stay ahead of problems, make informed decisions, and maintain stable, high-performing networks, without relying on reactive, after-the-fact responses.